Taming the Golang Stack Trace
An initial lengthy warning to curious readers: my specific needs may not be warranted in more traditional or small scale uses of Go. Go already has some great tools for “real” deadlock detection as well as general tools for profiling and lock tracing (see pprof). However, in the Docker engine, many external-to-Go forces are at work: external binaries/utilities are being executed and many goroutines are in potentially long-lived IO wait or syscalls (e.g. filesystem operations, network interactions). To the end user these appear quite similar to a traditional deadlock, and to the operator of a Docker cloud or cluster, some tools will be required to figure out the culprit of these pesky situations that may include combing through tens of thousands of lines of Golang stack trace data. This post is my response to this perceived need, and those more familiar with the Go ecosystem may provide me with even better ways to accomplish this task!
For some reason I tend to make people think I like to read Go stack traces from the Docker engine. It seems to be a gift that keeps on giving, as the more I figure out weird problems by staring at reams of stack trace data, the more I get sent new ones over time. This predicament is further enabled by the fact that I work for a company running a production-level container cloud based on Docker, and the operators of this container cloud know that I’m that “Docker maintainer” guy upstream that might be able to help figure out these issues. So, with that in mind, I’ve been trying to solve the challenge of looking at traces that contain significant amounts of useless data hiding that 50-100 line gold mine that gives me the root cause as to why 100s of goroutines are all stuck waiting on a specific lock. While looking for that root cause, I have to ignore another significant pile of goroutines which are simply waiting on a container monitor to exit, or log buffers to fill for copying, or any other number of normal activities happening within the Docker daemon.
Recently I decided the answer would be found in using more of the computer’s brain than my own for reducing my data overload to a smaller, more useful set of data. As an aging software programmer who fondly remembers days of crafting beautiful yet overly complex SQL queries, a traditional relational data solution was my first thought: normalizing each goroutine’s metadata and stack trace into a query-able set of entries. Given time is a precious commodity these days the amount of work needed to do the database design for that solution kept me from doing much more than thinking about it! However, I’ve been casually interested in learning more about the ELK stack, and specifically I’ve seen recent examples of this stack being used for general data search/tracking problems beyond simple log analysis. The two quick examples that came to mind are from my good friends Arnaud Porterie: his “vossibility” stack for tracking GitHub data, and Jess Frazelle‘s strace2elastic for stuffing syscall data from container execution into Elasticsearch.
So, with that growing interest and the fact I would have to do much less work to try an Elasticsearch-based solution, I decided it was time for me to take the next step. First I would need a parser for the Golang stack trace format. Less than a minute of GitHub searching led me to the awesome panicparse project by Marc Antoine-Ruel which already handles taking textual Golang stack trace data and encapsulating it into a useful Go structure, easily marshaled into the necessary JSON.
Check out my elastistack GitHub project
So, fast forward to today and I’ve created a simple tool, elastistack, which will take a Golang stack trace dump and bulk load it into a running Elasticsearch endpoint. But, the real question is, does this actually help me more efficiently and easily find the kind of issues I’m looking for? I’m glad to say the answer is yes so far, and I’ll provide an example here to help illustrate.
An Example using Elasticsearch and Kibana
First, if you have a stack trace dump and want to follow along, I’ve tried to make startup fairly painless. It should only take two commands to get a local Elasticsearch and Kibana instance up and running and loaded with stack trace data:
$ docker-compose up
  // wait for elasticsearch and kibana to start
$ elastistack import --input docker-log-stackdump.txt
  // at this point your import of data was successful
When you use Kibana (go to http://localhost:5601 in your browser) for the first time with new indices, you will be asked to locate the time-based indexes before going further. On that initial page that loads, replace the default/pre-filled logstash text with simply “stacktrace” in the entry field, and in a moment you should see “event_time” offered as the time index field. Select it and now the indexing should complete. A quick note on what event_time actually contains: since the goroutine entries in a stack trace have an integer number of minutes that they have been in the current state, the elastistack tool takes a time of now() and, on each insert, sets the time of that entry to this “time of now” minus the goroutine’s minutes value. This places the goroutines appropriately along a timeline which ends at “now” (the time you ran the elastistack tool), with the running or non-waiting routines being at the far right of that timeline. A future improvement would allow the user to specify the actual time the trace was taken if there was a desire to align the stack trace events with “wall clock” time–for example to line up with other debug information taken from the incident.
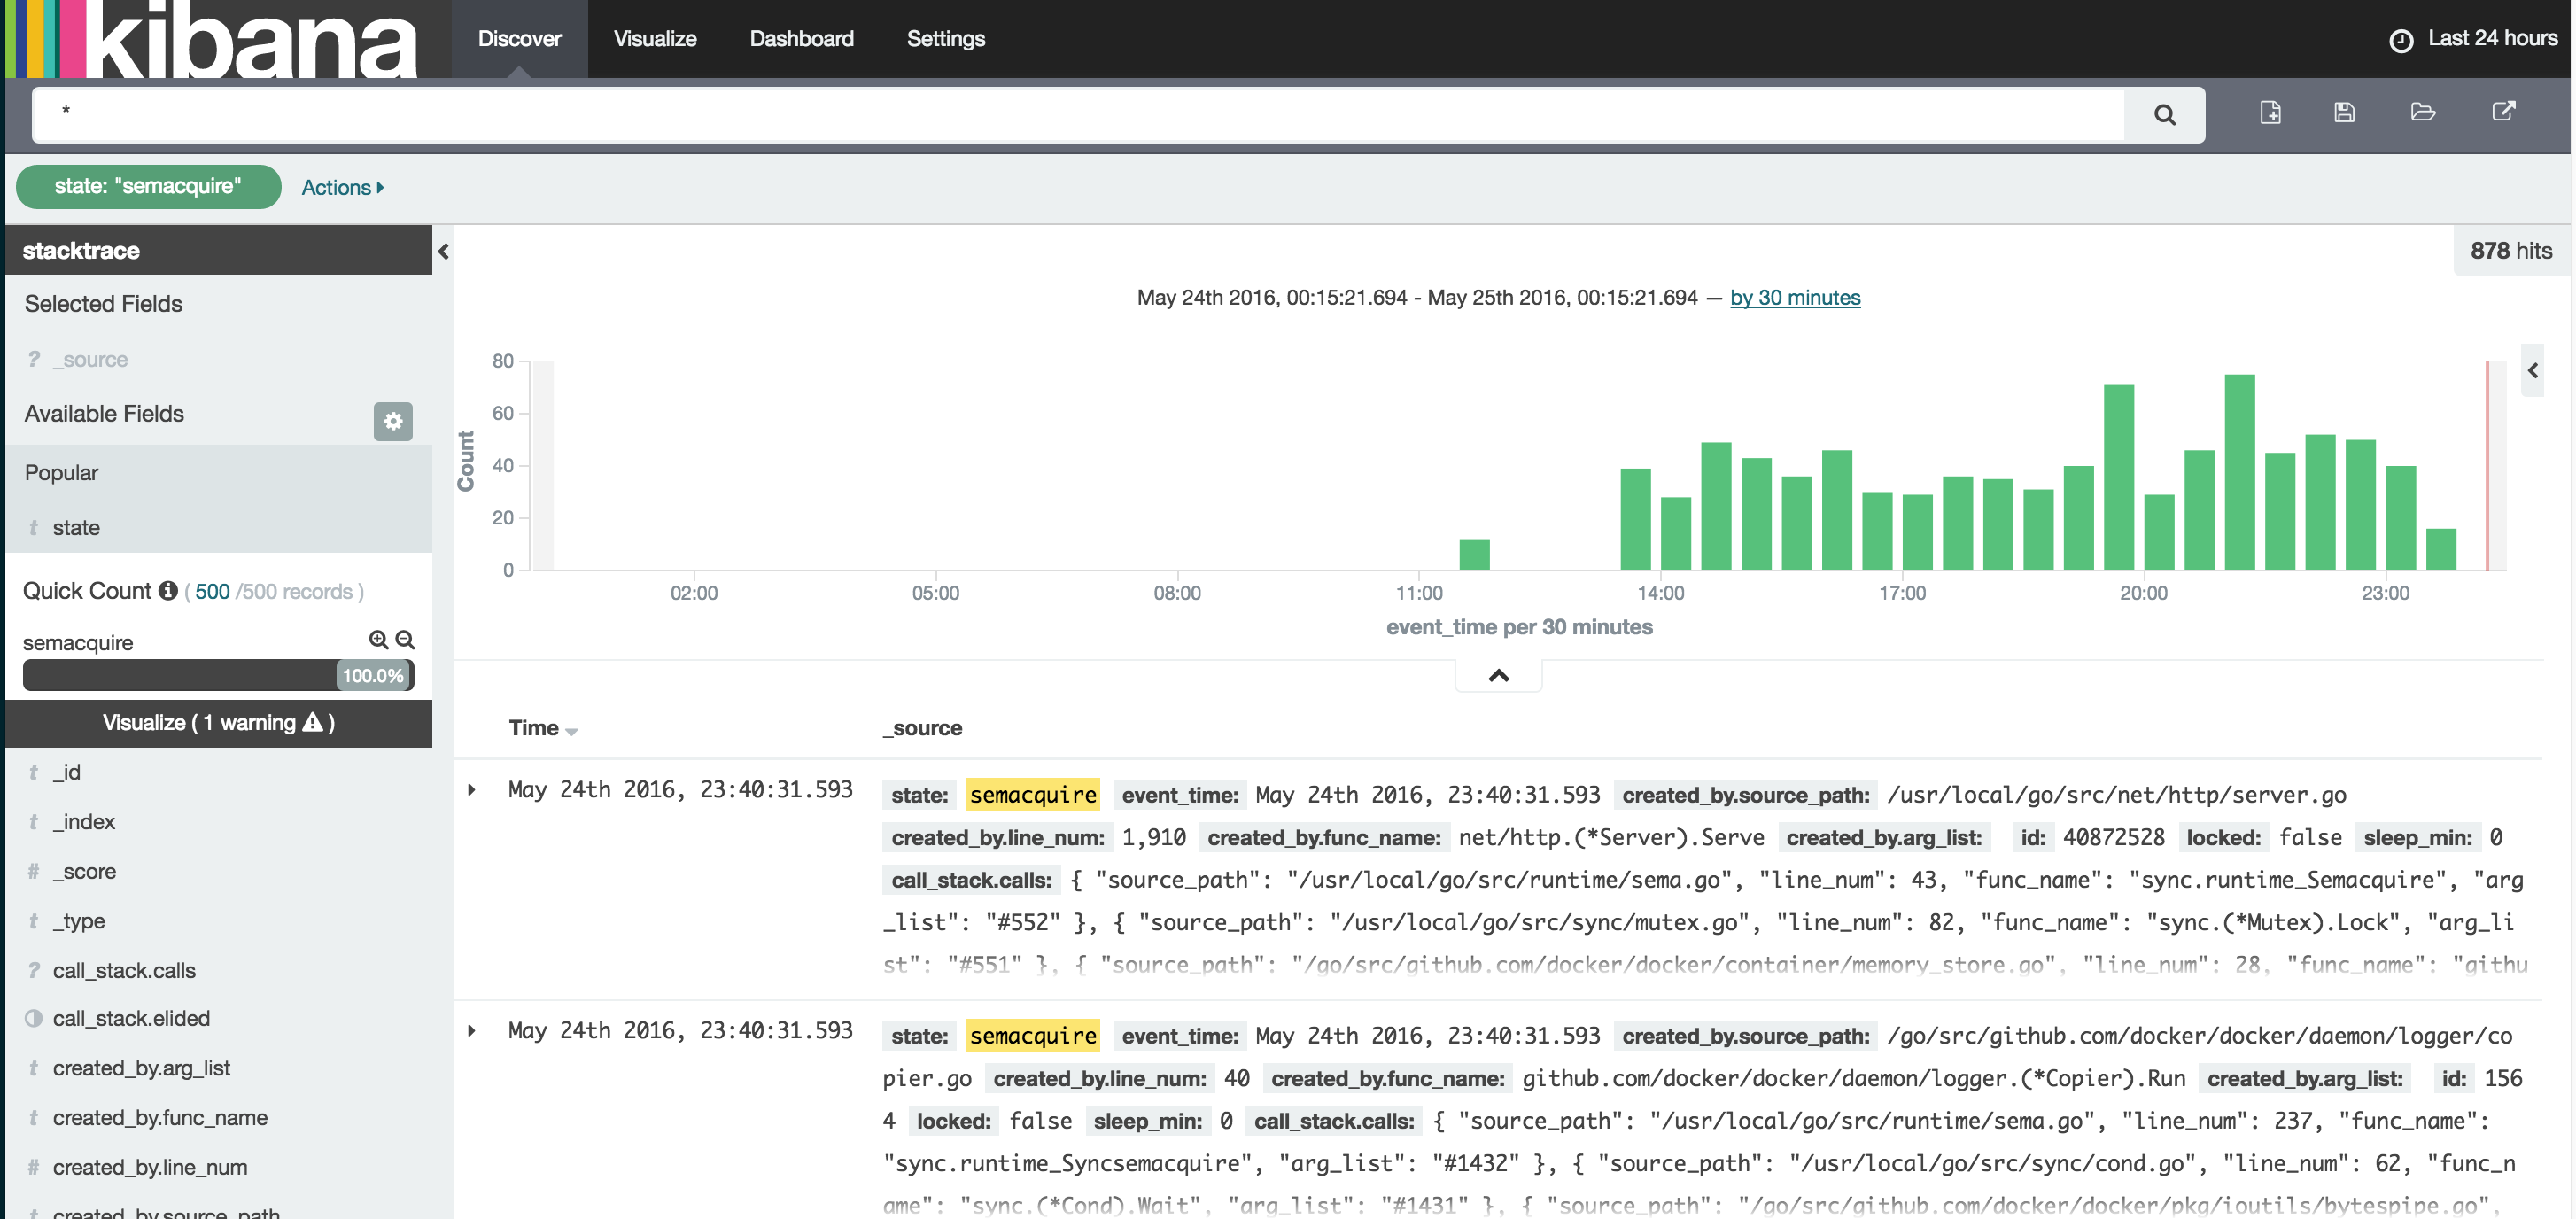
Figure 1: Kibana: View all with state:”semacquire” in last 24 hours
In Figure 1 above we took our newly imported dataset and asked Kibana to show us the last 24 hours; and because I’m looking at a seeming deadlock scenario I’ve filtered my view with the search state:"semaquire". In this case it was almost too easy to quickly see the time our problem began; other than a small blip a few hours earlier, there is a spike with a consistent set of “semaquire” state goroutines following it to the end of the trace. In Kibana we can simply click on that first “bar” of the spike to zoom in.
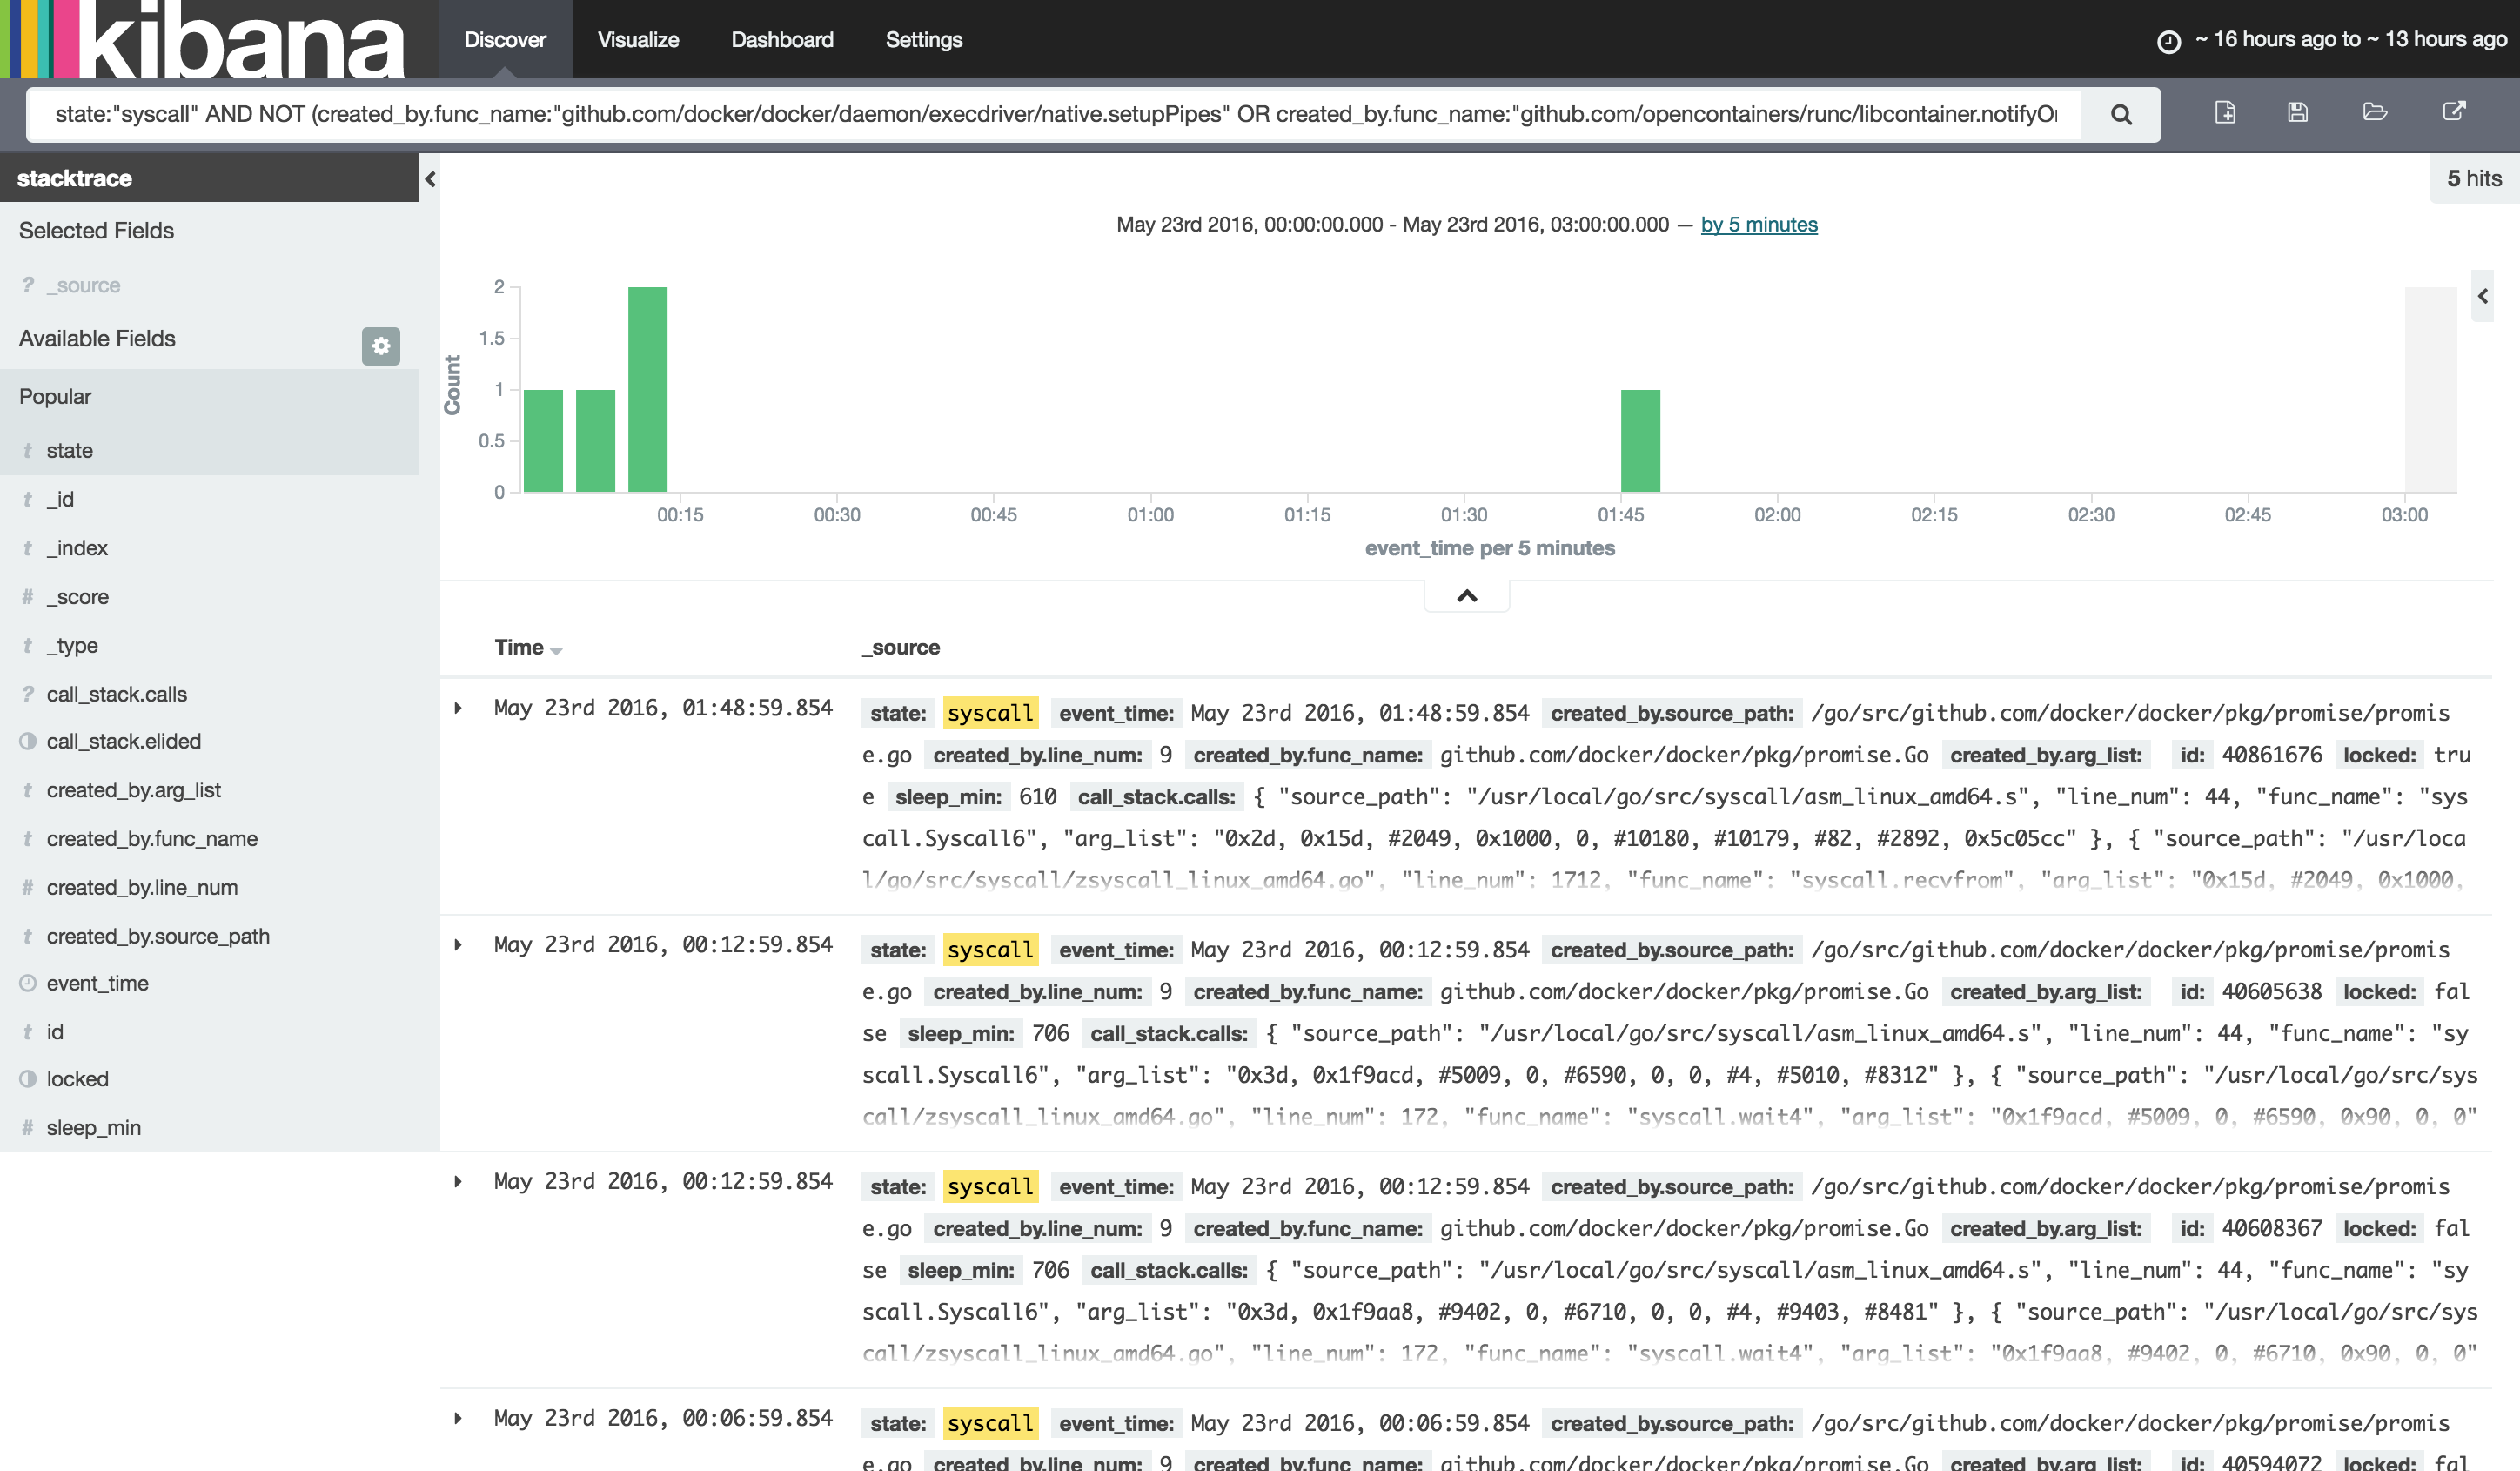
Figure 2: Kibana: Zoomed in and filtered on syscalls
In Figure 2, I’ve zoomed in and switched from state:"semaquire" to a search on state:"syscall". I already know from this point on I have tons of goroutines entering semaquire state and getting stuck waiting for a mutex that is already locked. Now I want to find out what goroutine might be holding that lock, which requires that I know something about my codebase, or that I’m willing to dig a bit, as at this point the stack trace data won’t actually help me know who owns that lock everyone else is waiting on (aside: I would love to see this as a Go feature improvement, as Go must have this data somewhere). In my case, I know I don’t have a traditional deadlock, so I’m looking for some other goroutine that’s stuck not on a mutex but on some other system activity that isn’t completing. Now, in some cases your data set may still be too large, and one way to get rid of more extraneous data is to remove more data from your view that is “normal activity” in the Docker daemon. The following filter was used in one case, knowing that each container has a setupPipes goroutine and a notifyOnOOM goroutine that will live until the container exits:
state:"syscall" AND NOT (created_by.func_name:"github.com/docker/docker/daemon/execdriver/native.setupPipes" OR created_by.func_name:"github.com/opencontainers/runc/libcontainer.notifyOnOOM")
In other cases, you may get extremely luck and when zooming in and switching to syscall search, you are left with a single goroutine, which turns out to be the culprit:
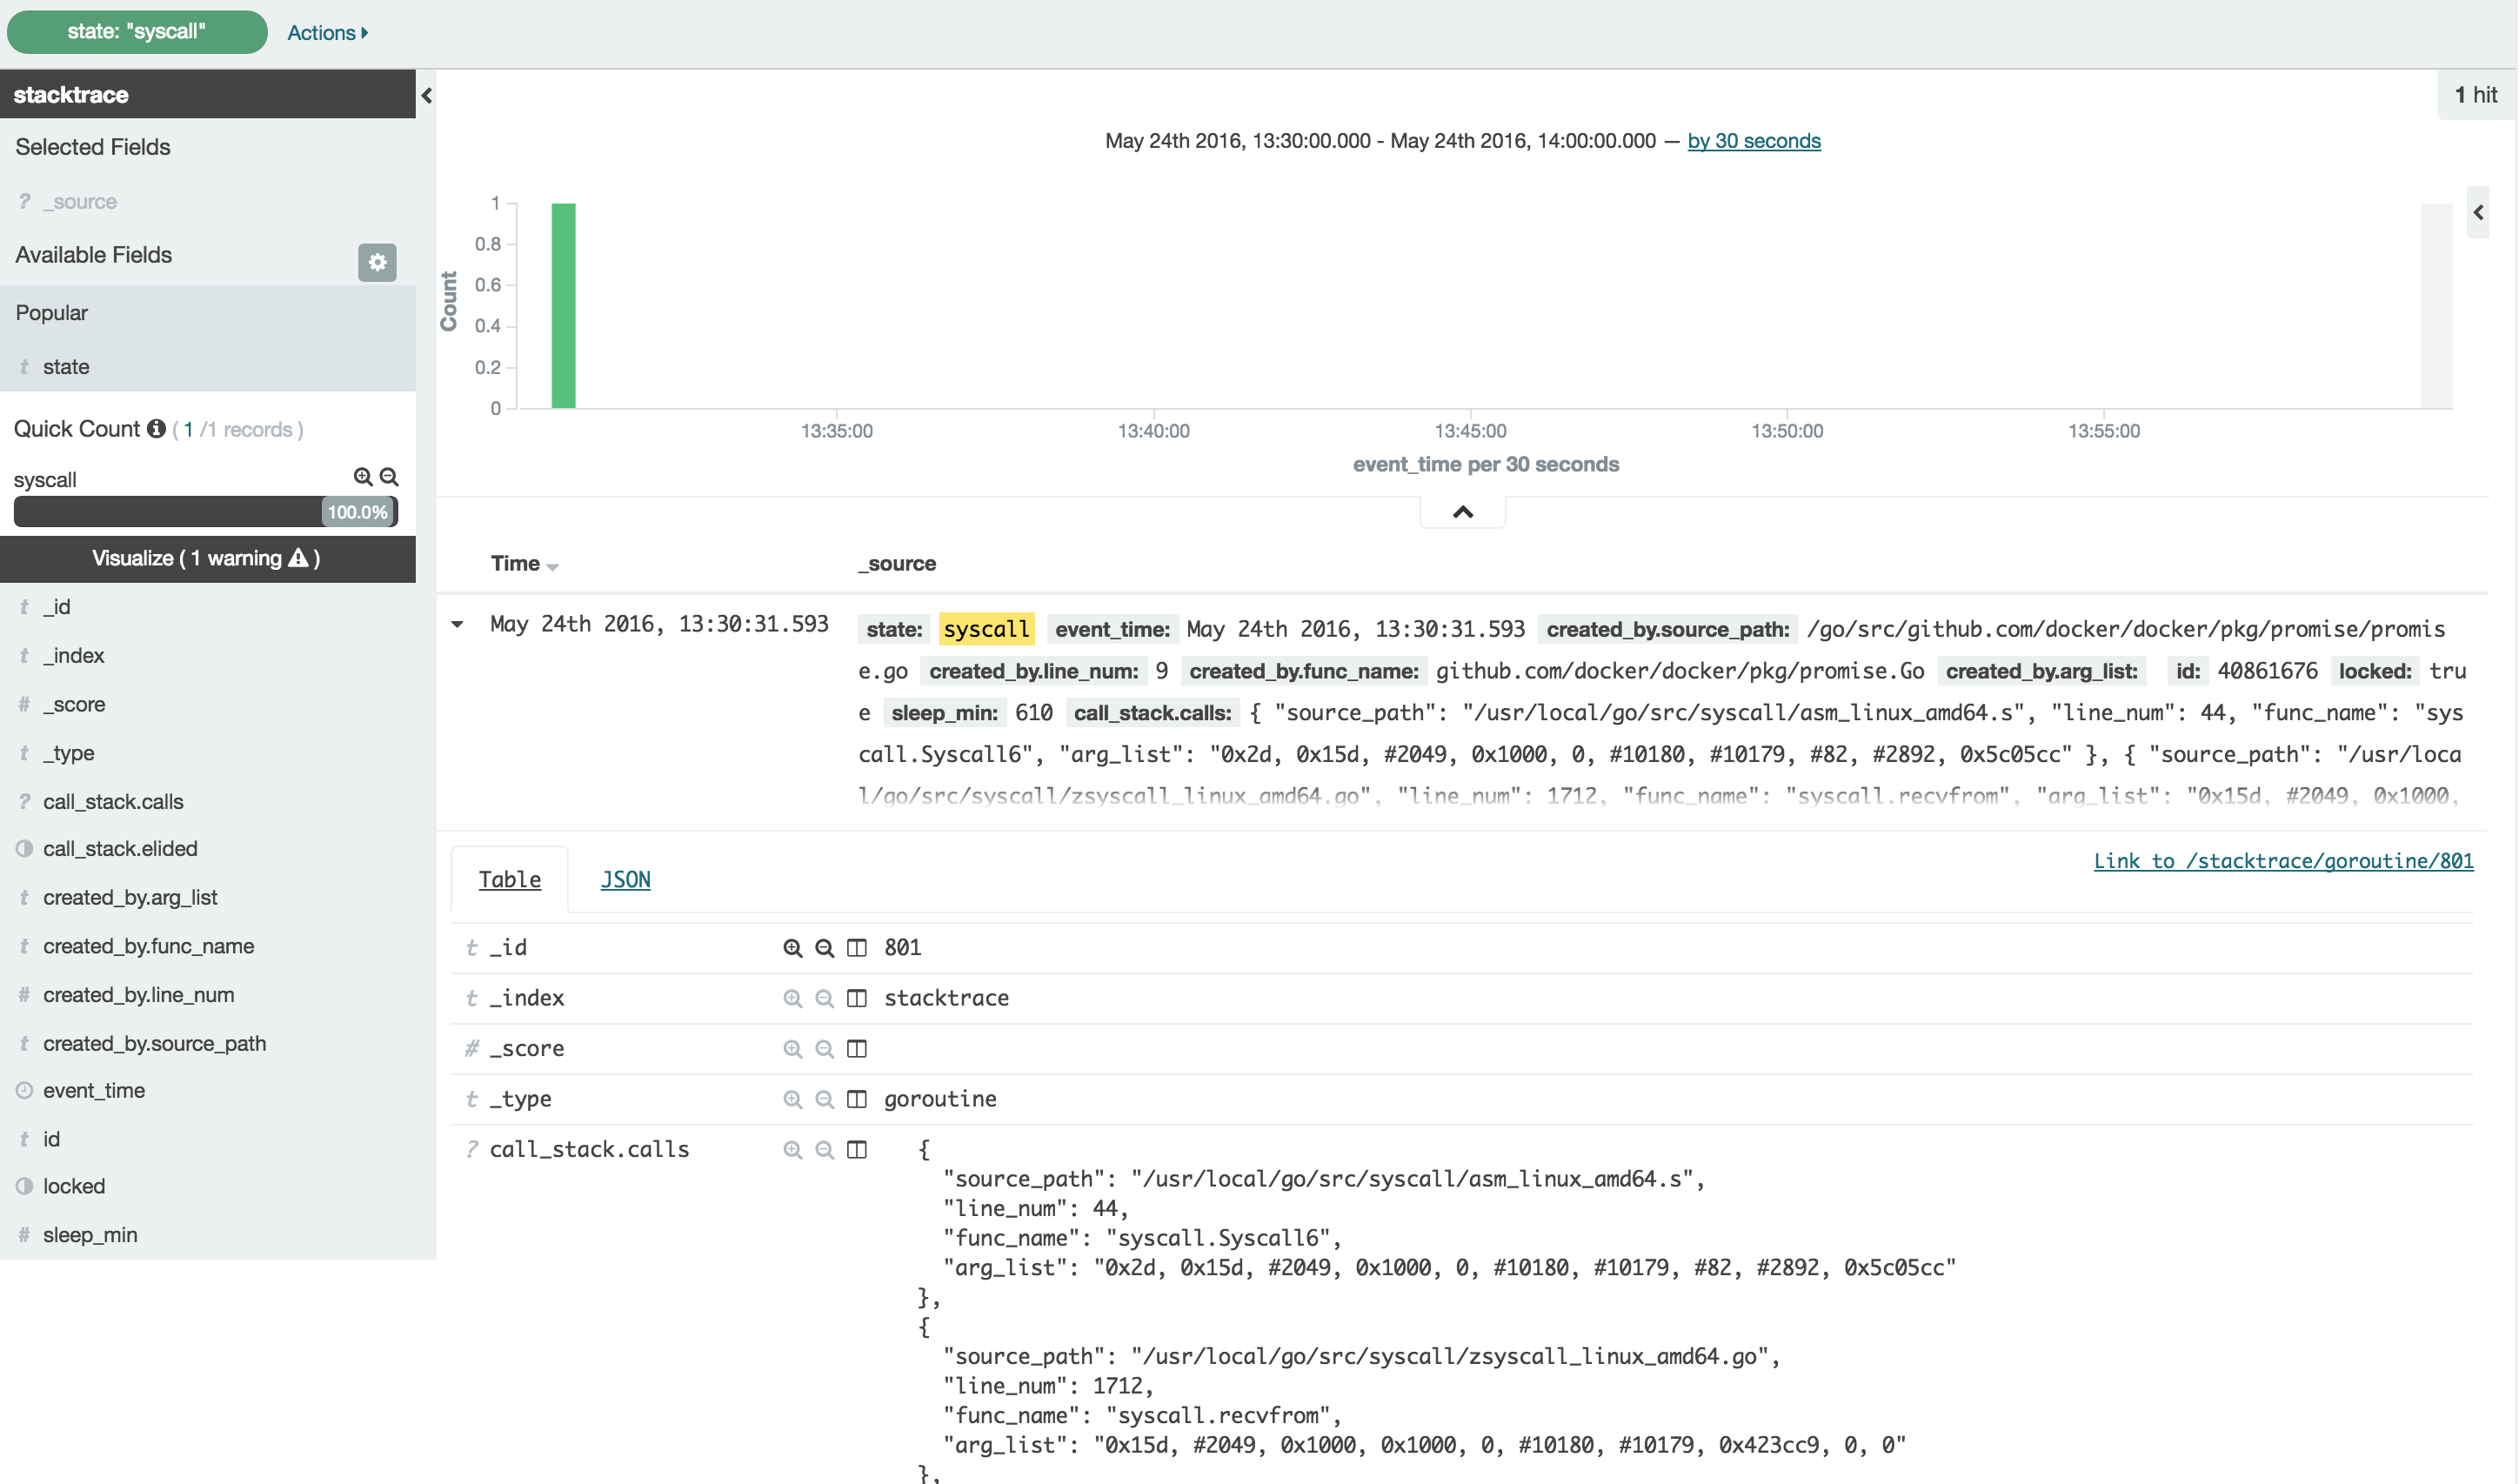
Figure 3: Kibana: Single syscall entry stuck on a syscall: recvfrom()
For this particular case, what we’ve found (see Figure 3 above) is that a recvfrom() syscall from within the libnetwork code has been in a state of waiting on a response that appears will never arrive at this point. The particular event is a netlink message send/response during the deletion of a libnetwork endpoint (the virtual network interface in a container), and it seems that every now and then the netlink conversation doesn’t complete, causing this hang. As I mentioned above, I didn’t get everything I needed just from this data. This particular issue requires knowledge of the codebase to know that the bottom of this call stack (part of it is visible in Figure 4) is a function in which the container’s lock is being held during this close/cleanup operation. It is from that knowledge that I now understand why all other API requests into the daemon that need this container’s lock are hanging.
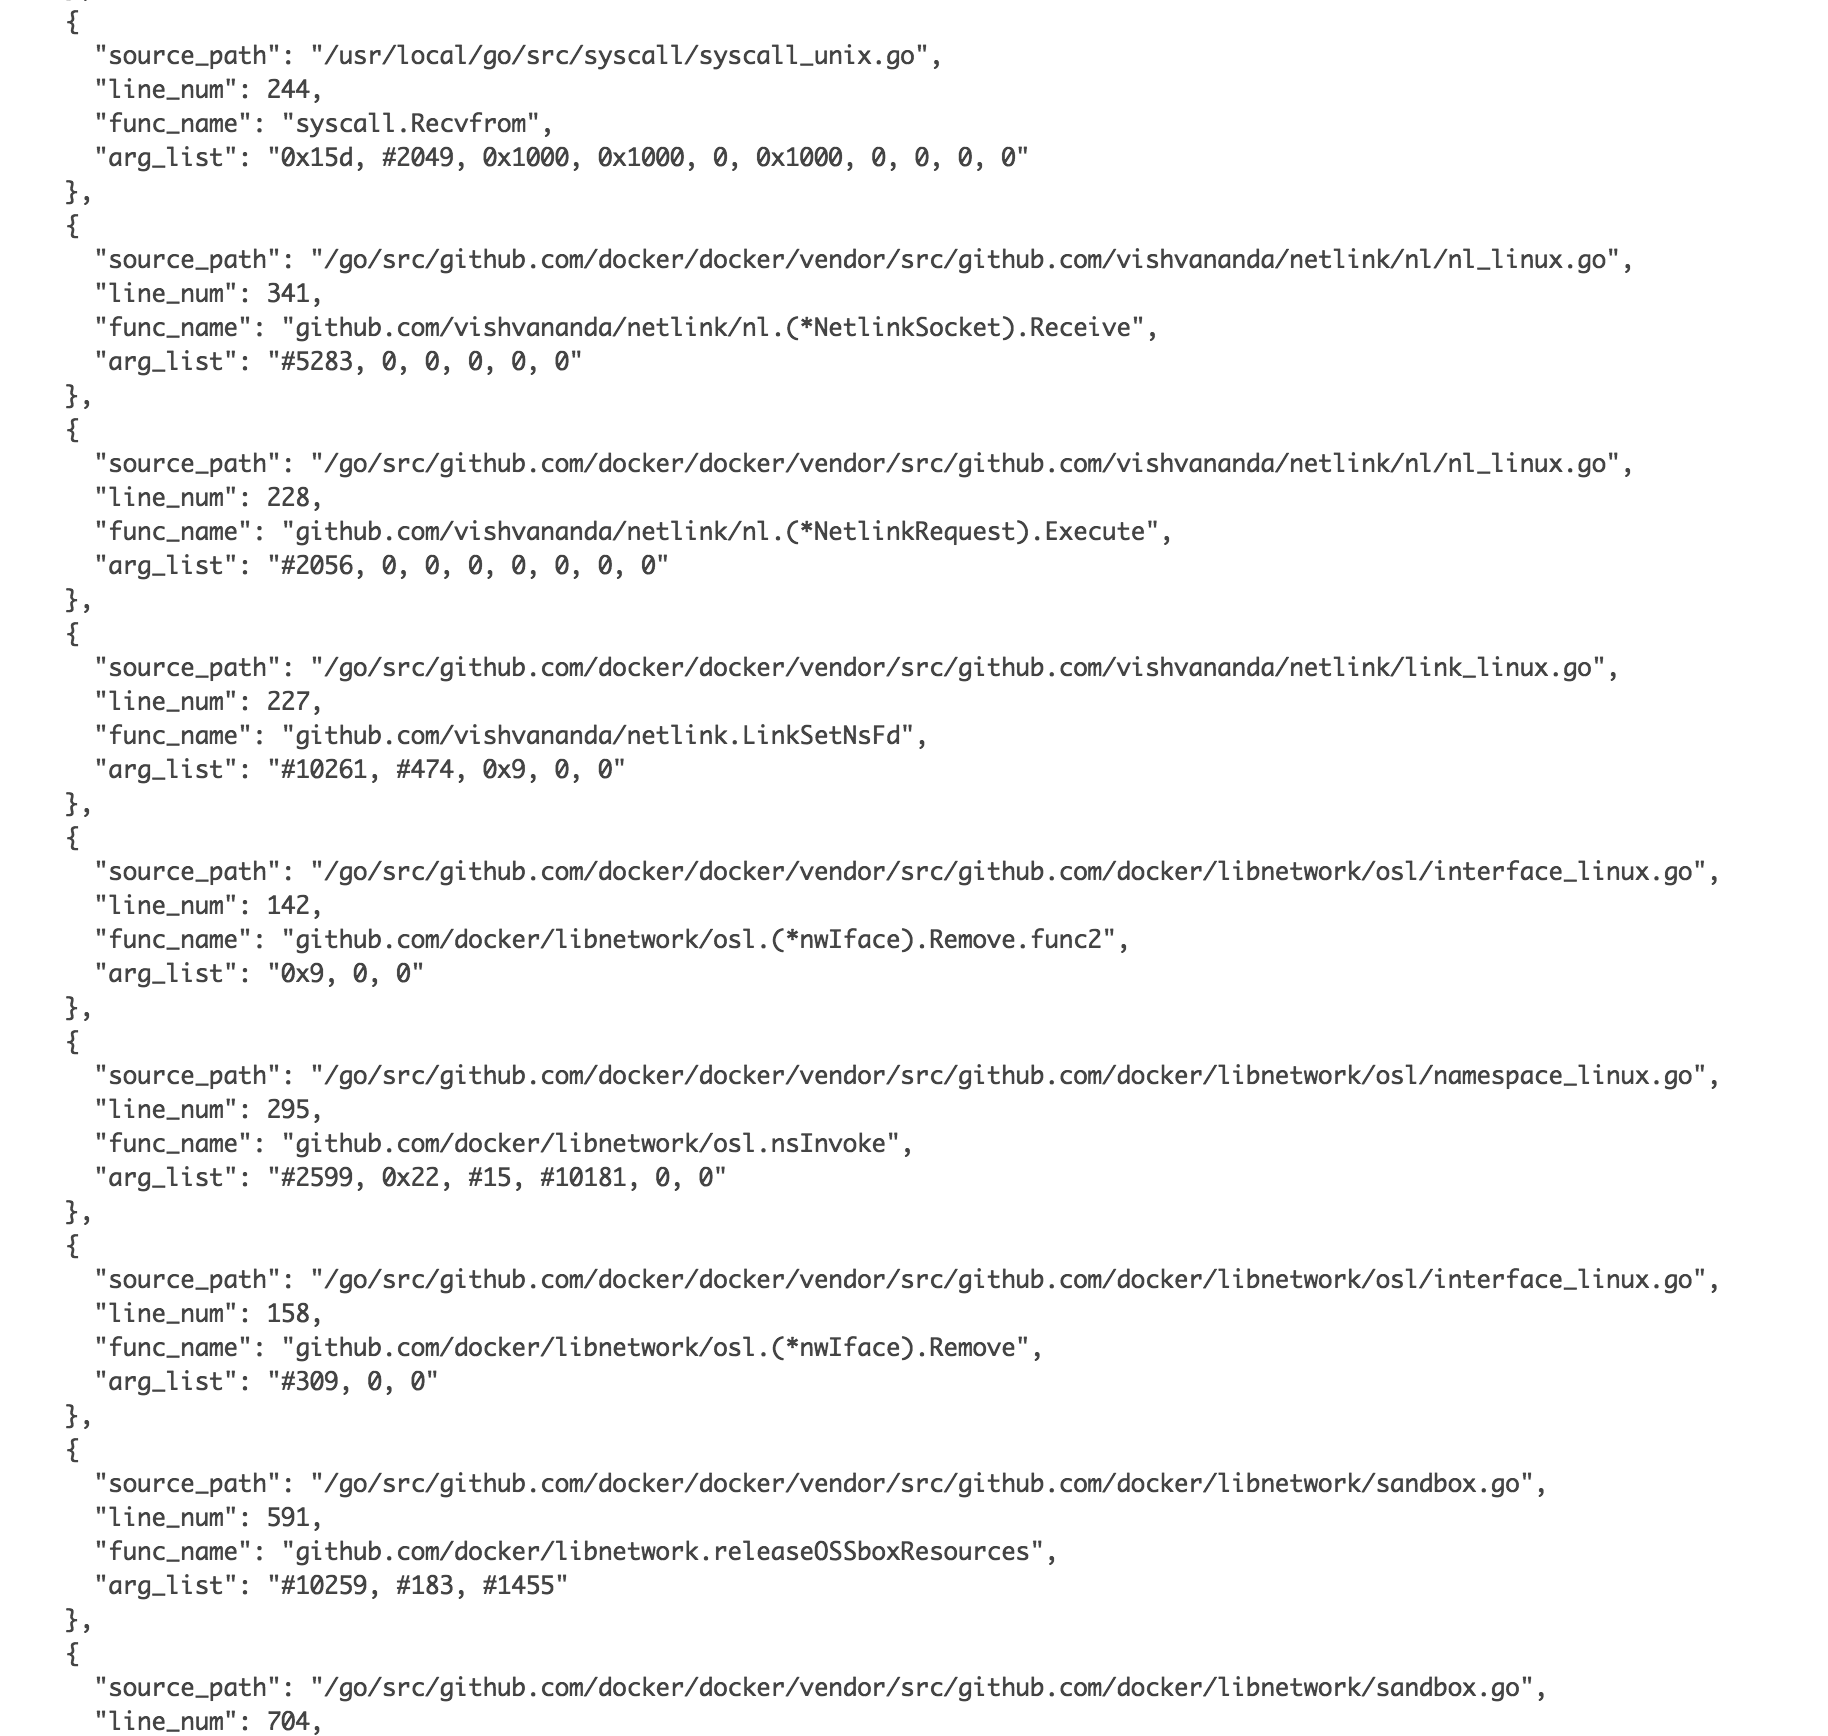
Figure 4: Stack trace detail from Kibana/Elasticsearch
So, is this tooling the be all and end all of debugging for deadlock-like scenarios from a large and busy stack trace? I can’t claim that just yet, but definitely this Elasticsearch-based solution provided me an additional viewpoint over the data set that allowed a much quicker dive into the details of where I might find my problem. Will it be useful for other projects or other scenarios? Hopefully some of you can let me know if you have the chance to try it!


Nice! I had written a small script (https://github.com/clnperez/golang-utils/blob/master/goroutine-stats.py) to pull create a summary of dumped goroutines, but I really like the ability to drill down visually.